Two hundred years ago, shares were traded between an elite group of wealthy individuals through social groups which often met in coffee houses. How to research share prices back then was to order an espresso and ask the right individual!
Now, a small investor only needs a good internet connection to gain access to almost unlimited amounts of information, analysis, data and opinions.
Many websites have paywalls and charge investors for access. Below, we will show you how to find plenty of reliable information for free.
How to research share prices or see a share price graph
Use Google Finance to research share prices and view price trends on a chart. Search by a company name to
How to research share prices is incredibly easy with Google Finance. We can use the results page to find out much than just the share price of public companies.
How to interpret Google Finance share prices
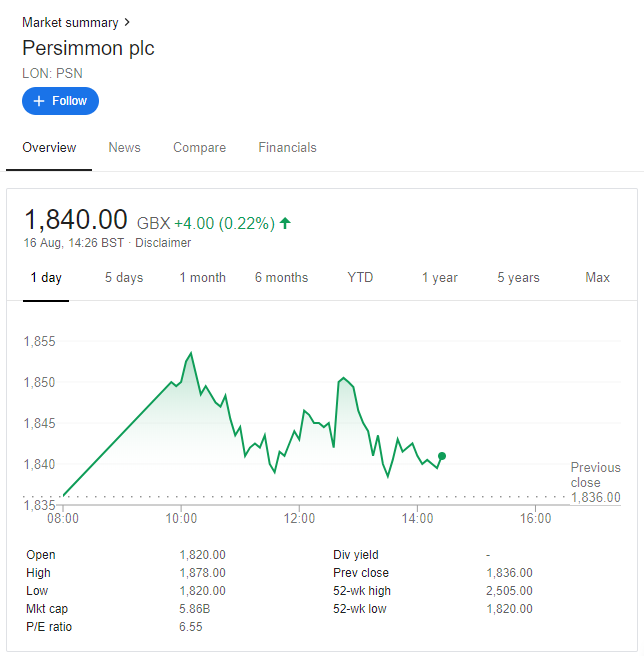
Let’s analyse what information the Persimmon Google Finance snapshot provides at a glance.
“LON: PSN” means that Persimmon’s ticker symbol is ‘PSN’, and its shares are traded on the London Stock Exchange. As we explain in How to Buy Shares and Invest in the Stock Market, the ticker symbol is a quick way to identify a company on stockbroker and financial websites.
1,840.00 is the latest live share price.
“GBX” next to the price means pence. Therefore the share price is £18.40.
“+4.00 (0.22%)” reflects the daily movement so far today. The snapshot above tells us that the Persimmon share price has gained 4p (or 0.22%) on its closing price yesterday.
If you click on the ‘disclaimer’ link, you will be able to understand whether the price data has any time delay. This page reports that London Stock Exchange data is in realtime. This page also tells us that the Google Finance price data for shares listed on the Hong Kong Stock Exchange, for example, will lag behind the realtime price by 20 minutes.
The table of data below the price graph can give some further insights into a share. However, exercise some caution when reading the Div yield.
If a company has not yet listed via an Initial Public Offering (IPO), Google Finance will have no information on the company until the business has floated on the stock market.
Understanding the Google Finance dividend yield
Caution is required because Div yield is not calculated consistently across finance websites.
Some calculation methods are more useful than others. Google Finance does not make it clear, whether their dividend yield uses a forward-looking projection of dividends or backwards-looking data. These two calculation approaches will give dramatically different answers if a company has recently announced a change to its dividend payout level.
For example, where a company announces it will slash its dividends, (as companies often do), its share price will probably fall, for reasons we explain in our article ‘What are shares, and why do people buy shares?’.
In our Google Finance snapshot, “-” should be interpreted as Google not having sufficient data to calculate the dividend yield or the company does not have a policy of paying dividends.
Understanding other Google Finance information: Market Capitalisation
Other information in the Google Finance table can provide further insights.
“Mkt cap: 5.86B” displays the total value of all shares that are tradeable on the stock exchange. This is known as the Market Capitalisation of a company, or Market Cap for short. Persimmon’s Market Cap is £5.86 billion. Permission’s market This gives an insight into the size of the business and helps us appreciate that Persimmon is a titan in its industry rather than a plucky start-up.
Understanding other Google Finance information: Price to Earnings Ratio
“P/E ratio: 6.55” means that the share price is 6.55 times greater than its diluted earnings per share. This is why it is known as the Price to Earnings Ratio.

Let’s prove how the ratio is calculated. The latest set of financial results at the time of writing is Persimmons’s 2018 Annual Report, which discloses diluted earnings of £2.81 per share on page 99.
£2.81 earnings per share x 6.55 P/E ratio = £18.40, its share price. Therefore we can understand how Google Finance has derived the ratio of 6.55 using real information.
The ratio between price and earnings communicates a lot about how confident shareholders are in the prospects of the business. The higher the P/E ratio, the more shareholders are prepared to pay for a pound of current income. The implication of a high P/E ratio is that earnings are likely to grow in future, or have a high degree of certainty. A company with a low P/E ratio may have little opportunity for future growth or significant risks about its future. The average P/E ratio of FTSE 100 companies at the time of writing is 17.31, as reported by Bloomberg.
This is just a high-level overview, we will expand more on P/E ratios in future articles.
How to obtain financial statements
Download all publicly available financial statements at Companies House.
Companies House is the registrar of all companies in the United Kingdom. For no fee, you can search by company name and download all accounts and other information in a pdf format. The documents will be in black and white and are sometimes difficult to read as they have been scanned in.
You may have to wait up to 9 months following the end of a company’s financial year before financial statements are available, as this is the deadline by which companies are required to file them.
Alternatively, all public quoted companies also provide their financial statements on their website. The advantage of using this source is that the documents will be in colour and easier to read and search electronically. The Annual Reports of FTSE 100 companies can often be over 200 pages long, therefore it is very helpful to be able to press ‘ctrl + F’ and search for what you are looking for.

The key financial statements are the Profit & Loss/Income Statement and the Balance Sheet. These show the profit for the year and the assets & liabilities of a company respectively.
If the company follows international accounting standards, they may be named ‘The Statement of Comprehensive Income’ and ‘The Statement of Financial Position’ instead.
Which types of investors rely on share prices?
Investors who follow the technical analysis trading method are the most reliant traders (read more: the best technical analysis books).
Day traders also watch prices extremely careful, as their profits are generated from very short-term fluctuations in share prices (read more: the best day trading books).
Otherwise, any ordinary investor in stocks and shares will want to understand the background on price movements before they pick a stock. For more information on investing in shares, look at our shortlist of the best stocks & shares books for beginners.
Course Progress
Learning Summary
How to Research Share Prices and Company Information
Search a company name in Google Finance to find out its live share price
Share price information from some stock exchanges may be delayed by up to 30 minutes.
The ticker symbol will be shown, which will allow you to quickly find out more information about the company on other financial websites.
The market capitalisation of a company is the value of all of its shares that are tradeable on the stock exchange.
The price to earnings ratio (P/E ratio) expresses the share price as a multiple of the earnings per share.
Companies with a higher P/E ratio are seen as more 'expensive'. This usually reflects either higher growth prospects, reliability or whether the sector is a preferred destination for investor cash currently.
You can download a set of financial results for any UK company from Companies House website.
For listed companies, including those outside of the UK you can visit the 'Investor Relations' or 'Corporate' section of their website to find an official and digitally searchable version of their Annual Report or interim results announcements.
Quiz
Next Article in the Course

Before you move on, please leave a comment below to share your thoughts. What resources do you use to look-up infomation and investigate companies further? Please share with us, so that others can learn from your experiences.
Comments 6
Dear Sir/Madam,
we specialize in connecting our investors with high-quality, revenue-generating companies seeking
funding across various stages and sectors. Further details regarding the capital funding and requirements
can be shared upon your confirmation of interest. Please let us know if you would like to proceed
with a discussion. If this opportunity is not of interest to you, no further action is required.
Best regards,
RB
Vert & M | Outside Sales Representative
Hi
Get free, expert-written content designed to keep your readers engaged—no AI involved!
Choose the topic, and we’ll craft a high-quality, SEO-optimized article for you.
Want some topic ideas? It’s all free!
Let me know.
Take advantage of our Annual Vacation Sale and save 25% or more on select hotels when you book by March 31.
Plus, enjoy more travel options with Southwest Airlines now available on Expedia.
Your dream trip is just a click away. Secure your savings today!
Limited-time offer – book now!
https://expedia.com/affiliate/PtwPYx8
The Future of War Lies Beneath the Waves…
What happens when silence is broken at 800 meters depth?
A new geopolitical thriller has surfaced —
“The Depths of Silence: The Shadow of Submarine Warfare”
— a gripping, realistic dive into underwater battles of the near future.
In 2037, fragile peace between the Federal Atlantic Union (FAU) and the New Continental Empire (UMI) collapses.
A covert UMI submarine fleet violates territorial waters. The alarm is triggered.
The FAU’s JE-450, submerged and waiting, prepares for a confrontation no one wanted… but no one can avoid.
⚓ Realistic tension.
Global stakes.
Underwater warfare like you’ve never experienced.
If you’re a fan of Tom Clancy, military thrillers, or submarine warfare, this book is your next must-read.
Dive in on Amazon now:
https://www.amazon.com/Depths-Silence-Shadow-Submarine-Warfare-ebook/dp/B0F7X7ZMDK
Stay silent. Stay deadly. Stay one step ahead.
— The war of the future begins beneath the surface.
Hello,
We are a private lending company and we offer all types of loans tailored to meet individual needs to all locations. Our secured loans are guaranteed.
We also offer loans to Business firms, companies and individuals at an affordable interest rate of 3% we provide short or long term loan even with poor credit ratings, We shall process your loan as soon as we receive your application via e-mail: [email protected]
Rgds,
Jessica Lincoln.
Risk officer
Hey financial-expert.co.uk, I’m Nad and I don’t want to sound like a salesman, but we’ve just launched, got first 1000 keychains in stock and trying to get first customers.
if I give you personal 20% discount on the first item, can you help our company grow?
Nad,
Director of Lockhubcars
Website: https://lockhubcars.com