I was recently disappointed at the availability of real house price growth charts online, so I decided to publish my own here on Financial Expert.
Everyone in the UK will have been bowled over at some point when an elder relative has explained to them that they bought their house in 1960 for £2,500, or a similar story.
This certainly paints a vivid picture. It gives the impression that houses were extremely cheap to buy in the past.
This wasn’t the case. While it’s true that houses are less affordable now than they were in recent generations, the impact of inflation does hugely exaggerate the difference when we compare house prices over time.
For example, an £8,000 house price in 1960 needs to be understood in the context of average weekly wages being just £14.10 (man) and £7.30 (woman), based on this government dataset. This compares to £665 for a working-age adult today.
This means that a £2,500 house still represented 3.5 times a man’s annual wage. Over such long periods, the context of inflation is hugely important.
Why I produced a chart of real house prices
As part of my guide to investing in property, I explain that property has historically lagged behind buying shares in terms of raw performance.
Many people dispute this – pointing to the doubling of London’s house prices over the last decade, in comparison to a lack-lustre performance of the FTSE 100.
It’s only when we view inflation-adjusted, or ‘real’ house price data that we can begin to understand the real gains in wealth which have arisen from the growth in house prices. The best property investment books always include both nominal and inflated-adjusted data.
And it’s this type of information which is useful when building a basic investment portfolio. We need to be able to understand the relative performance of different asset classes in real terms.
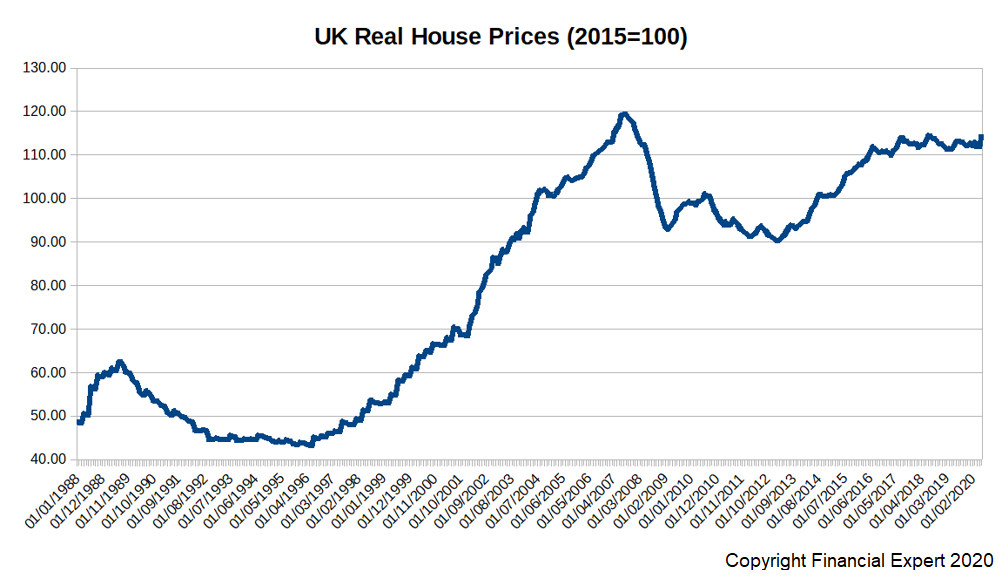
Chart of growth in real house prices in the UK
This graph shows the inflation-adjusted prices of UK housing from 1988 – 2020.
UK house price growth chart sources
The chart below is based upon data from two sources:
- House Price Index (HPI) data published by the Land Registry
- Inflation (CPI) data published by the Office for National Statistics
I have chosen to use the CPI measure of inflation rather than RPI. This is because RPI includes the effect of housing costs. If we were to adjust nominal house prices by an inflation rate which includes increases in the nominal house price, this is a little like dividing a number by itself, and would result in a flatter, meaningless figure.
By using the CPI, we can show the change in house prices in terms of the increase in buying power for other consumer goods.
Enjoying this article? For more property investment wisdom, check out this list of the best property investment books.
More sources for house price data:
Online property platforms (Zoopla, Rightmove etc) allow you to review the house price history of properties sold in a postcode (this data is taken from land registry).
You can access the Land Registry yourself to research house prices, however, may will be charged for certain reports. Better to gain access to that same data for free through the portals above.
The government issues several house price reports, such as the House Price Index which I used as the basis for this chart.
Other organisations such as mortgage lenders and estate agents also compile their own house price indices, on the basis of the transactions which they observe such as:
These are helpful, but can differ from each other for the same period, owing to the different sampling populations and geographical biases.
Much like political polls, it’s helpful to create an ‘index of indexes’ by averaging together price movements from multiple sources.
Comments 1
Thank you for providing this chart as I had wondered myself how house price increases correspond in real money terms to inflation. Were you able to calculate an average annual percentage increase over the period of 1988 – 2020?