This article will explain how to diversify your investments using the science of diversification. To get there, we will walk through logical steps which build to the conclusion. Therefore you will also be able to explain why sophisticated investors diversify in a specific way.
The primary objective of successful investing is to generate high returns while minimising the risk. The two elements of risk and return must be in balance. Seeking high returns with little regard to risk could lead to a total wipeout of your investment. However, applying too much caution could lead to your stocks and shares ISA barely returning more than a savings account!
In this article, we will begin by introducing the two types of risks inherent in all investments. We will look at how the right investment choices will eliminate one risk and mitigate the other. This is the science of diversification and how it can produce the optimal trade-off between risk and reward for your investments.
If you’d like to learn about diversification in greater detail, we recommend the following book series:
Defining the enemy: what is investment risk?
In investing terms, when we mention ‘risk’, we refer to how much an investment’s return deviates from its average. An investment which produces a stable return each year has zero volatility. An investment which bounces between gains and losses has a high level of volatility.
Volatility is the enemy of investors because it hurts in two ways:
- It is painful to experience wild fluctuations in your wealth. This becomes a real test of discipline because humans tend to become emotional when experiencing wins and losses.
- With all else equal, a volatile investment will perform worse than a stable one over the long term. We can demonstrate this below:
| Investment performance | Mean average return per year | Actual portfolio value after ten years |
|---|---|---|
| 5% annually | 5% | £1,629 |
| 3% then 7% alternating | 5% | £1,626 |
| -5% then 15% alternating | 5% | £1,556 |
| -15% then 25% alternating. | 5% | £1,354 |
| -25% then 40% alternating | 5% | £904 |
| -50% then 60% alternating | 5% | £328 |
Compared to a stable return of 5%, adding volatility reduces the performance of the portfolio. When the return bounces up and down, end up worse off. The effect becomes extreme at high levels of volatility. You will notice that the last two investments lose money. This is despite their returns still averaging at 5% annually.
So why does the value suffer if returns are volatile? This is due to a mathematical principle. A 1% fall is not fully compensated by a 1% gain.
£100 x 0.99 x 1.01 = £99.99, not £100. In other words, if an investment underperforms by 1% in year 1, but then overperforms by 1% in year two, it closes at a lower valuation than if it had not varied each year.
Therefore when large falls occur, it takes even larger gains to break even. Therefore over time, a volatile portfolio value will diminish relative to a stable but similar average return.
Individual investments have their own risk and return
All individual investments have a risk level and an expected return which corresponds. An investment with low volatility/risk will tend to have a lower return. Investments with high volatility will generally deliver higher returns.
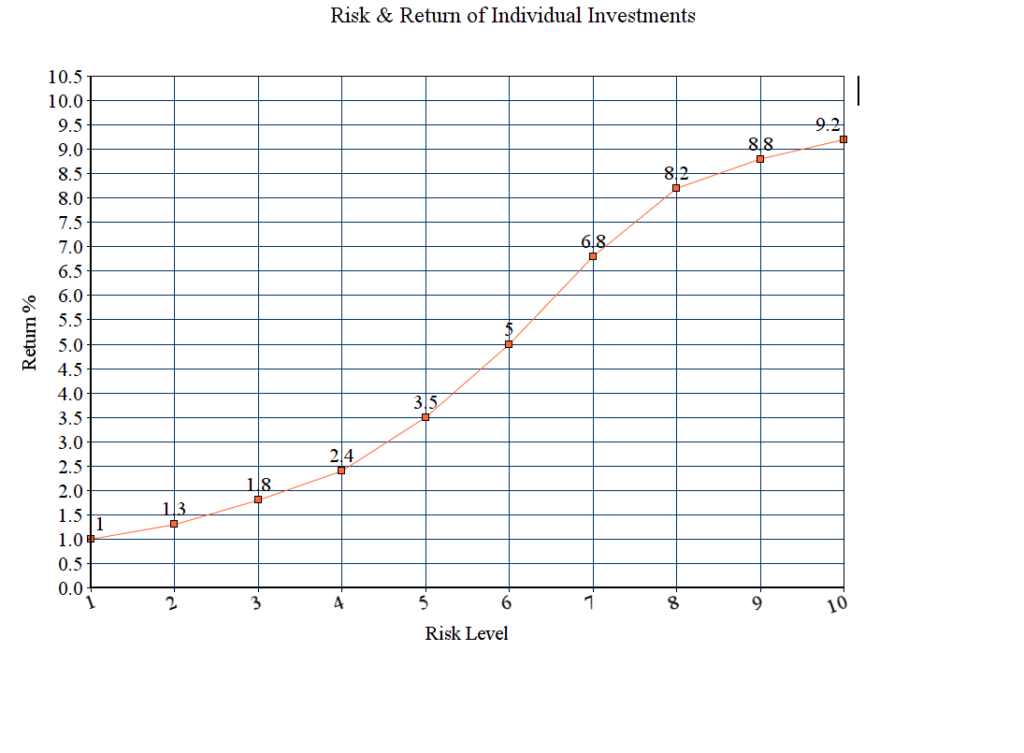
You will notice the steep slope of the curve in the middle of this risk range. This suggests that investors receive an additional return for each extra unit of risk between risk level 4 and 8. However, the slope begins to flatten, at which point investors experience diminishing returns for taking on ever-increasing levels of risk.
How to maximise returns
To maximise the investment performance, should we place all our money in top returning investment?
No, we shouldn’t. The reality of living with a single high-risk investment is bleak.
With a high-risk investment, the chance of complete failure and loss of capital is real. It may not be likely, but it’s likely enough that you will struggle to dismiss it.
If you place all your retirement savings in the shares of a single company, you are taking a huge risk. You are betting your life savings on a single company maintaining its profits for the next 30 years.
Companies go bankrupt for a whole host of reasons. These include mismanagement, changing consumer trends, technological obsolescence. Or an economic downturn, fraud, the withdrawal of bank finance, a regulatory whiplash, or seizure by a future government.
Any one of these scenarios could be disastrous for your personal wealth. Under these circumstances, any adverse company press would likely cause you to feel a high level of anxiety.
The old adage about not keeping your all of eggs in one basket becomes relevant. Before we explore exactly how one should divide those eggs, let’s delve deeper into the risks of shares.
Unsystematic versus Systematic risk
Unsystematic risk, also known as specific risk or unique risk, arises from events unique to an individual company.
Examples include poor strategic decisions, a fire at the warehouse, or a windfall gain. They could also include a research & development innovation, or an employment dispute. Each may cause the share price to move up or down, but generally, would have little impact on other companies.
Systematic risks are factors that influence entire industries and nations. These include interest rate changes, economic booms and busts, political regime change, natural disasters and changes in investor appetite.
Together, these two risks account for all movements in the share price.
It is important to understand the difference between the two because we must tackle them in different ways.
Unsystematic risk: The avoidable one
This brings us back to eggs and baskets. Unsystematic risks – the factors unique to a company, are like random noise that distort share prices. Some news weeks are quiet, other weeks will feature multiple events. Sometimes it’s good news, and other times it’s bad.
When money is spread across multiple companies, the effect of this noise begins to cancel itself out. The bad news for some of your shareholdings will be offset by the good news of others.
In fact, the effect of unsystematic risk effectively disappears if you spread the risk across enough investments.
How many will do the trick? As many as you can! Spreading your money across more companies will always reduce your unsystematic risk. However, beyond 20 companies the extra benefit from each additional company becomes minor.
If you invest in funds which hold over 20 companies, then you have already diversified your unsystematic risk. This is the first part of the science of diversification.
Systematic risk: The inescapable one
Systematic risks affect an entire asset class (e.g. shares, corporate bonds, investment property) in a particular industry or region. This means that simply spreading your money across many companies within the same asset class does not solve the problem. If the worldwide economy tips into a recession then most of your shares will fall across the board.
This element of risk cannot be eliminated. This is the risk that investors are compensated for in the risk and reward equation.
The following diagram helps visualise what we have learned so far about unsystematic and systematic risks. It shows how the overall investment portfolio risk changes with the number of companies invested in.

The diagram shows that systematic risk remains a constant even when portfolio size changes. However, there is a way to reduce the overall risk to your portfolio with the help of some portfolio magic. To do so, we need to understand how asset classes work and how they correlate with one other.
Introducing asset classes into the mix
In our article Should I save or Invest? Why you deserve better than a Savings Account, we introduced the key asset classes:
Cash, Equities (Shares), Debt (Bonds), Property, Commodities.
Practically speaking, these asset class labels are too broad and cover too wide a range of assets to be useful when building a portfolio. ‘Bonds’ could refer to rock solid, governent backed investments paying just 1% interest. Alternative ‘Bonds’ could refer to the high-risk corporate bonds of a company circling bankruptcy, which yield 20%. We will need to be able to describe the building blocks of a portfolio with more precise to be able to control risks.
Therefore investors usually construct their portfolio by handpicking ‘sub-classes’ instead.
Asset sub-classes
Each asset class can be divided into ‘sub-asset classes’, where an asset class is split by region, industry or maturity.
The table below shows an illustration of sub-classes that sit within each asset class.
| Equities (By Size) | Equities (By region) | Property | Bonds | Commodities |
|---|---|---|---|---|
| Large Cap | UK Equities | UK Residential Property | UK Government Bonds (Gilts) | Gold |
| Mid & Small Cap | US Equities | UK Commercial Property | UK Corporate Bonds | Silver |
| Fledgling / AIM listed | European Equities | Global Residential Property | Europe Corporate Bonds | Other precious Metals |
| Developed Asia Equities | Global Commercial Property | US Corporate Bonds | Oil | |
| Emerging Markets Equities | Junk Bonds | |||
| Emerging Market Bonds |
This list isn’t comprehensive. but gives a flavour of the variety of sub-classes.
How asset classes can reduce systematic risk
You can manage financial risk by combing multiple asset classes together in your portfolio. This is the second part of the science of diversification.
Asset classes don’t all react in the same way to events. For example, in hard times, shares and corporate bonds may fall in value. However government bonds may increase in value as investors flock to ‘safe’ investments. On the other hand, when an economy is booming central banks raise interest rates. In this rosy environment, shares will increase in value as projected dividends increase. In reaction to a rate interest rise, however, the value of government bonds will likely fall.
If two asset classes respond to events by moving in the same direction, they are said to be ‘correlated’. If investments move in opposite directions, this is known as a negative correlation.
Investors want is to allocate their funds to asset classes or sub-asset classes which have two characteristics:
- a) positive expected returns individually and;
- b) low or negative correlation with each other
A mixture of these investments will be excellent companions in a portfolio.
The following chart demonstrates a law of physics, but I have repurposed it here to explain the correlation concept. It shows what happens when two investments with negative correlation are placed in the same portfolio.
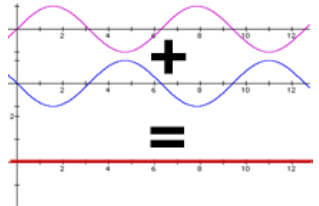
This explains why portfolios are usually comprised of more than one asset class. Yes, you could specialise in ‘European equities’ and buy 20 companies from that sub-class. But in doing so, you would fully expose your portfolio to the full systematic risk of that asset class.
By combining European equities with corporate bonds, you are combining two asset classes with low correlation. Therefore as the diagram above shows, you will produce a more stable return.
Read more: The best bond investing books
A portfolio is greater than the sum of its parts
You will recall that at the start of this article, we explained how volatility hurts returns. Now we will use a real investing example to show how volatility can be capped with the science of diversification.
The following ‘quilt’ produced by JP Morgan helps illustrate the stabilising effect of diversification. Each colour represents a sub-asset class.

You can see that some asset classes are the highest returning investments of the year, then become the worst-performing. The white ‘Balanced portfolio’ represents the return from a combination of all asset classes. As a result of low correlation, the Balanced portfolio cuts a far steadier path through the ranking each year.
It is never the highest returning investment, but it is also never the lowest. Its range is -8.1% to 25% (8.4%). You can compare this to real estate (orange) in isolation, which ranges from -17.5% to 37.1%.
Course Progress
Learning Summary
The Science of Diversification
The key risk for investors is a fall in the value of an investment. Owning a highly volatile investment is stressful and could result in you missing your financial goals.
The science of diversification reduces the volatility of investments by combining them carefully within an investment portfolio.
A volatile portfolio will also be worth less than a stable portfolio over the long term, even if the 'average' returns are the same.
Investors in a specific asset class (e.g. equities) are exposed to the general systematic risks that affect all shares. Individual companies are also affected by unique or 'unsystematic' risks.
Unsystematic risks are random - positive or negative. Invest in over 20 assets to mute the impact of a single event. 'Noise' from news across your holdings will largely cancel out.
Systematic risks include changes to the overall economy and affect all investments in an asset class. Different asset classes may react to events in a different way. In other words, their movements have low correlation.
Investors split their portfolio across asset classes that have a low correlation. Such as shares and bonds. This produces a smoother portfolio return.
These principles guide the portfolios of sophisticated investors. Professionals spread their bets over many individual investments and also cover multiple asset classes with low correlation.
Quiz
Next Article in Course
Before you move on, please leave a comment below to share your thoughts. I respond to all comments.
Comments 1
Hello, it would be very useful if the quizzes told us which questions we get wrong in the investing courses. Thank you.